|
在本篇文章中,我们将主要介绍如何对来自连接到Arduino的传感器的数据进行统计。为此,本文使用了开源统计程序“ R”。严格来说,R是一种针对统计计算和图形的编程语言。而且,它有一个庞大的社区,提供各种算法的软件包。为了将数据从Arduino接收到R中,我使用SD卡读/写器。传感器数据(由Arduino捕获)写入SD卡,然后由计算机读取并加载到R中。
本文共包含三个部分:(A)设置带传感器、SD卡读写器和Arduino(Nano)收集数据,(B)收集数据并将其传输到R,以及(C)使用数据进行统计。
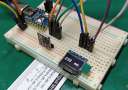
所需的材料清单: – Arduino Nano开发板 – 跳线 – 面包板 – 超声波传感器 – MicroSD卡适配器 – MicroSD卡
A(1/2):设置Arduino、传感器和SD卡读卡器 老实说,本文中的Arduino和传感器设置没有任何实际意义。它仅实现一个目的:收集一些可用于统计的数据。我选择使用两个HC-SR04型超声波传感器。将Arduino插入面包板的中间。一个超声波传感器插入面包板的左侧,另一个传感器插入右侧。左传感器测量到左侧的距离,而右传感器测量到右侧的距离。

在先前关于HC-SR04超声波传感器的文章中,我使用了一种使用pulseIn函数的方法。如果您的设置中只有一个超声波传感器,则此方法效果很好。如果您有两个同时测量距离的超声波传感器,则此方法不再起作用。在本文中,我将使用中断。当相应引脚上的信号改变其状态时,将触发这些中断。在Arduino Uno和Arduino Nano上,只能将数字引脚2和3绑定到中断。因此,超声波传感器的echo引脚连接到数字引脚2和3。

A(2/2):编程 如前所述,将使用中断用于测量距离。除此之外,其他所有内容都与我之前关于HC-SR04和Micro SD卡读取器的教程中介绍的代码相似。 在每次loop函数调用中,都将测量距离,然后将其写入文件。而且,旧文件在每次Arduino启动时都会被删除。 - #include <SD.h> //Load SD library
- // Pins of the ultrasonic sensors
- const int pin_echo_left = 2;
- const int pin_echo_right = 3;
- const int pin_trig_left = 6;
- const int pin_trig_right = 7;
- // variables that to track the duration of the echo
- volatile long echo_left_start = 0;
- volatile long echo_left_end = 0;
- int distance_left = 0;
- volatile long echo_right_start = 0;
- volatile long echo_right_end = 0;
- int distance_right = 0;
- // variables to write data to sd card
- int chipSelect = 4; //chip select pin for the MicroSD Card Adapter
- File file; // file object that is used to write the data
- void setup() {
- pinMode(pin_trig_left, OUTPUT);
- pinMode(pin_echo_left, INPUT);
- pinMode(pin_trig_right, OUTPUT);
- pinMode(pin_echo_right, INPUT);
- attachInterrupt(digitalPinToInterrupt(pin_echo_left), echo_interrupt_left, CHANGE); // only pins 2 and 3 are useable for interrupts on Uno, Nano and Mini
- attachInterrupt(digitalPinToInterrupt(pin_echo_right), echo_interrupt_right, CHANGE);
- pinMode(chipSelect, OUTPUT);
- if (!SD.begin(chipSelect)) { // Initialize SD card
- Serial.println("Could not initialize SD card."); // if return value is false, something went wrong.
- }
-
- if (SD.exists("stats.csv")) { // if "stats.csv" exists, fill will be deleted in order to gather new data
- Serial.println("File exists.");
- if (SD.remove("stats.csv") == true) {
- Serial.println("Successfully removed file.");
- } else {
- Serial.println("Could not removed file.");
- }
- }
- // write headers
- file = SD.open("stats.csv", FILE_WRITE); // open "file.csv" to write data
- if (file) { // Next, the headers (first line) of the CSV file is written
- file.print("DISTANCE_LEFT");
- file.print(",");
- file.print("DISTANCE_RIGHT");
- file.println();
- file.close(); // close file
- Serial.println("Headers were written to file!");
- } else {
- Serial.println("Could not open file (writing).");
- }
- Serial.begin(9600);
- }
- // this function is called by an interrupt on each change of the echo pin of the left sensor
- void echo_interrupt_left() {
- switch (digitalRead(pin_echo_left))
- {
- case HIGH:
- echo_left_end = 0;
- echo_left_start = micros();
- break;
- case LOW:
- if (echo_left_end == 0) {
- echo_left_end = micros();
- long duration = echo_left_end - echo_left_start;
- long durationOneWay = duration / 2; // divided by two, since duration is a roundtrip signal
- // acoustic velocity of air at a temperature of 20°C => ~343.5 m/s
- // => 0.03435 cm/us
- distance_left = durationOneWay * 0.03435; // distance in cm
- }
- break;
- }
- }
- // this function is called by an interrupt on each change of the echo pin of the right sensor
- void echo_interrupt_right() {
- switch (digitalRead(pin_echo_right))
- {
- case HIGH:
- echo_right_end = 0;
- echo_right_start = micros();
- break;
- case LOW:
- if (echo_right_end == 0) {
- echo_right_end = micros();
- long duration = echo_right_end - echo_right_start;
- long durationOneWay = duration / 2; // divided by two, since duration is a roundtrip signal
- // acoustic velocity of air at a temperature of 20°C => ~343.5 m/s
- // => 0.03435 cm/us
- distance_right = durationOneWay * 0.03435; // distance in cm
- }
- break;
- }
- }
- void loop() {
- // both ultrasonic are triggered to send an ultrasonic signal
- digitalWrite(pin_trig_left, LOW); // turn off the trigger
- digitalWrite(pin_trig_right, LOW); // turn off the trigger
- delayMicroseconds(3);
- digitalWrite(pin_trig_left, HIGH);// prepare to send "trigger" command to module
- digitalWrite(pin_trig_right, HIGH);// prepare to send "trigger" command to module
- delayMicroseconds(10); // wait for 10us (module sends signal only, if trigger had a HIGH signal for at least 10 us)
- digitalWrite(pin_trig_left, LOW); // module sends signal now
- digitalWrite(pin_trig_right, LOW); // module sends signal now
- delay(1000); // we wait a second... interrupts should be called by now
- // next we append the measurements to the CSV file.
- file = SD.open("stats.csv", FILE_WRITE); // open "file to write data
- if (file) {
- file.print(distance_left);
- file.print(",");
- file.print(distance_right);
- file.println();
- file.close(); // close file
- Serial.println("Values were written to file!");
- Serial.print("Left: ");
- Serial.println(distance_left);
- Serial.print("Right: ");
- Serial.print(distance_right);
- Serial.println();
- } else {
- Serial.println("Could not open file (writing).");
- }
- }
B:收集数据并将其传输到R 接下来,只需打开Arduino,然后将其左右移动一会儿即可收集一些数据。一段时间后,SD卡上的stats.csv文件应具有足够的距离值。特别是,Arduino程序以所谓的逗号分隔值(CSV)格式存储距离测量值。 stats.csv文件的第一行代表所谓的头。标头包含数据标签。下一行包含实际测量值。大多数统计程序都提供导入CSV文件的功能。此外,由于可以找到格式略有不同的CSV文件,因此统计程序通常具有一些其他便利功能,可以导入CSV文件。例如,某些CSV具有标头,而另一些则没有。此外,一些CSV文件用“逗号”分隔数据条目,另一些CSV文件则用“分号”分隔。

C:做一些统计 因此,下一步就是将SD卡从Arduino的SD卡读卡器插入计算机。然后,可以将SD卡中的数据加载到R。R存在许多不同的图形用户界面。通常,我使用RStudio,特别适合初学者。我不会介绍如何安装RStudio。您可以在RStudio网站上找到有关安装的更多信息。请记住,RStudio只是R的用户界面。除了RStudio,还必须安装R本身。此外,本文也不会介绍R。如果您不熟悉R,那么您可能想看一看R入门教程,以全面了解本教程。

RStudio工作区。
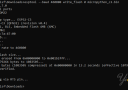
如果已经安装了R(和图形用户界面),请先将文件“ stats.csv”加载到R环境中。在R中,环境是存储变量的地方。在本文中,将R的工作目录设置为包含“ stats.csv”的文件夹。通常,用户界面(例如RStudio)提供了用于设置工作目录的选项。为了将CSV文件存储到R环境中,您必须输入data = read.csv("STATS.CSV");到R控制台。这样,您应该看到已将变量“data”添加到您的环境中。该变量应包含两个变量以及对这两个变量的一些观察。观察次数取决于您使用设置进行距离测量的时间。如果未设置工作目录,则必须在“ read.csv”中输入CSV文件的完整路径。
接下来,我们要计算距离测量的平均值。这可以通过在R控制台中输入mean(data$DISTANCE_LEFT)和mean(data$DISTANCE_RIGHT)来完成。左距离为12.13043,右距离为13.34783 [cm]。
如果您仅知道我的平均值,那么您将不知道是否真正移动了Arduino。我也有可能将Arduino放在障碍物之间,该障碍物向左约12cm,向右约13cm。在统计中,您可以利用标准偏差,该标准偏差可以为您提供有关观测值变化量的一些指示。更严格地说,标准偏差是方差的平方根。也许您现在正在问自己“什么是方差?”。方差是每个观察值与平均值之间平方差的平均值。在R中,通过输入sd(data $ DISTANCE_LEFT)和sd(data $ DISTANCE_RIGHT)计算左右测量的标准偏差。结果值为3.876554(左)和7.036326(右)。通常,人们会期望左右距离测量的标准偏差大致相同。差异是由于非对称物理设置、测量噪声、Arduino的偏斜运动等导致的。为了检查两个变量是否彼此相关,可以使用相关度量。皮尔森乘积矩相关系数(表示为r)就是这种度量。该系数的范围是-1到1。值-1表示两个变量完全不一致,值0表示两个变量是独立的,值1表示两个变量完全一致。在R中,可以通过输入cor(data$DISTANCE_LEFT, data$DISTANCE_RIGHT)来计算Pearson乘积矩相关系数。如您所见,该函数有两个参数,分别对应于两个感兴趣的变量。将函数应用于数据将返回–0.7782926。这表明这两个变量相当不同。这听起来合乎逻辑,因为如果我们将Arduino移至左侧,则左侧的距离测量值会减小。同时,右侧的距离测量值会增加。如果两个距离测量值同时增加,则相关系数将接近+1。
移动Arduino时,右侧距离传感器旁边会放置一个障碍物。结果,传感器数据之间的相关性非常低。

让我们修改设置。这次,我在移动Arduino时在右侧传感器旁边放置了一个障碍物。然后,我重复整个过程以将新数据获取到R中。我没有将数据值存储到变量“ data”中,而是创建了一个新变量“ data2”。用于读取CSV文件的函数调用如下所示:data2 = read.csv("STATS.CSV");。 接下来,您可以找到用于计算平均值、标准偏差以及相关系数的结果值:
mean(data2$DISTANCE_LEFT)= 11.94737 mean(data2$DISTANCE_RIGHT)= 3.421053 sd(data2$DISTANCE_LEFT)= 3.822066 sd(data2$DISTANCE_RIGHT)= 0.606977 cor(data2$DISTANCE_LEFT, data2$DISTANCE_RIGHT)= -0.2054429
仅从统计结果来看,人们可能会猜测右侧传感器发生了某些事情。例如,标准偏差非常低(0.6…)。如果障碍物在传感器前面,它将测量到相同的距离值。结果,标准偏差接近于零。此外,由于一个传感器测量实际距离,而另一个传感器始终测量相同的距离,因此两个传感器值不再相互关联。这样,相关系数接近于零。
通过以上内容,我们可以使用统计信息“衡量现实世界中正在发生的事情”。而且,至少在我看来,在查找系统故障或代码中的错误时,统计数据可以像万用表一样有用。 |